Update: Oct. 6, 2018 1:18 p.m.
The National Weather Service just tweeted a caution that the Guadalupe gauge in Kerrville has been malfunctioning:
The gauge located at the Guadalupe River at Kerrville has been malfunctioning and did NOT reach record flood level. USGS is currently addressing the issue. The latest reliable reading was 12.07 ft at 1PM. Data could be questionable until the issue has been resolved.
That means much of the following description, which relied on the gauge readings, is likely inaccurate.
Original Story (based on malfunctioning gauge)
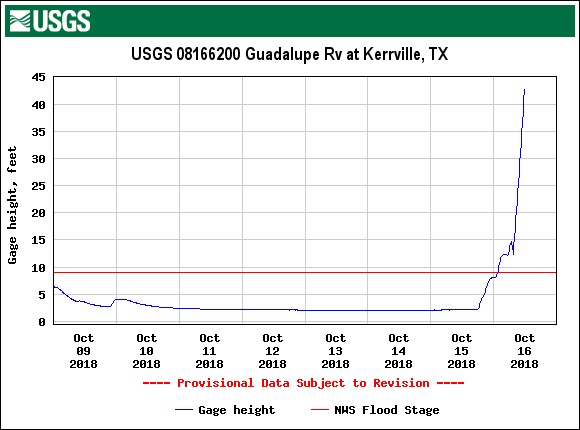
Around 6 p.m. on Oct. 15 the Guadalupe River at Kerrville, Texas, started to rise, as heavy rains fell. A cold front had moved though the day before. Since mid-September, the region has been routinely drenched, and the soil was already saturated.
So around 2 a.m. on Oct. 16 the Guadalupe River hit flood stage—which is defined by the National Weather Service as a gauge height of 9 feet. Typically the US Geological Survey gauge floats at a height of 1 or 2 feet. By around 4 a.m. the reading was higher than 12 feet.
By 10 a.m. it was over 27 feet. The USGS realtime data is provisional.

The discharge corresponding to a normal flow for this time of year is around 100 cfs (cubic feet per second). The 27-foot gauge reading corresponds to about 129,000 cfs.
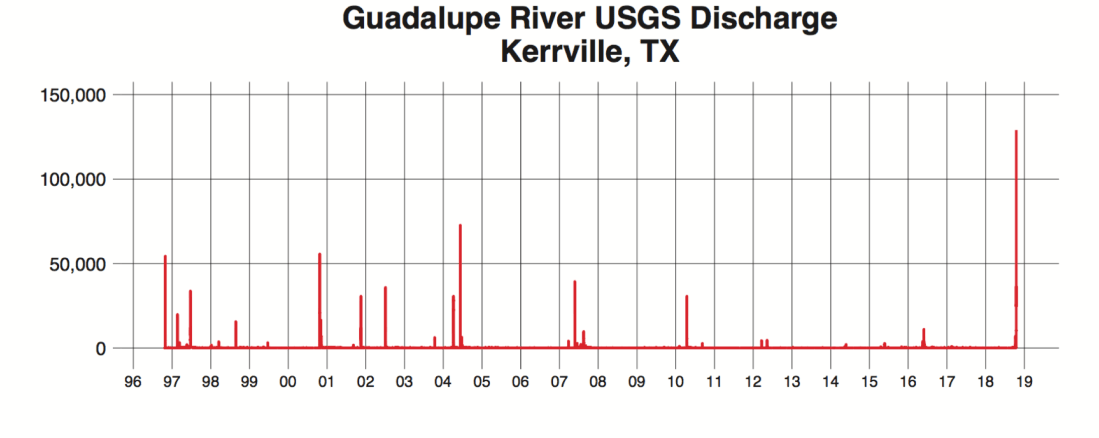
Historical data available from USGS for discharge goes back to 1996, but for gauge height only to 2007. Based on the discharge numbers, the amount of water flowing through the Guadalupe on the morning of Oct. 16 was almost twice as much as the next-highest amount in the last two decades. The previous high since October 1996 came in 2004.
Before 2010, this kind of high water was more frequent, as the Guadalupe’s discharge topped 20,000 cfs nine times between 1996 and 2010.
At 10 a.m. the water is still rising.
Update: 10:45 a.m.
The latest real-time gauge number is 34.61 feet. The record, according the information on the National Weather Service website is 39.00 feet on July 2, 1932. Next highest was 37.72 feet on July 17, 1987.
That means the current flood will rank at least third for the period covered by NWS historical numbers.

The NWS description of the impacts associated with the 35-foot gauge level, the highest level with a description, reads like this:
Major flooding inundates many lowest homes and businesses in Kerrville. Lowest homes and mobile homes flood above Center Point to near Comfort. Secondary and primary roads and bridges in the flood plain are extremely dangerous. Near the USGS 1:100 year flood level.
Update: 11:45 a.m.
The latest gauge reading is 42.66 feet, which eclipses the record of 39.00 feet from 1932 that is indicated on the NWS website.