Based on data from the National Transit Database, ridership on the public bus system in Bloomington, Indiana, has trended slightly downward in the three years since 2014. After peaking at 3.51 million riders in 2014, the annual figure has slipped to 3.49 million (2015), 3.45 million (2016), and 3.30 million (2017).
 Ridership grew by 70 percent over the previous decade—from 2004 through 2013—and saw growth each year during that period. What, if anything, accounts for the recent trend downward?
The slight erosion in ridership might be due to the arrival of ride sharing services like Uber and Lyft in the Bloomington market. If university students make up a significant percentage of Uber and Lyft patrons, and if the public transit ridership slip is the result of students opting for a ride sharing service instead of the public bus, one reasonable approach would be to look for the phenomenon in the month-to-month data.
That’s because ridership in Bloomington shows a clearly seasonal pattern—likely a function of the academic calendar and the town versus gown population. According to Indiana University, 43,710 students were enrolled on the Bloomington campus in 2017. The most recent US Census Bureau estimates put Bloomington’s population at 84,465.
If the downward trend for ridership on public buses is due to university students taking Uber and Lyft instead, then months that have fewer rides based on the seasonal pattern should show less of a downward trend than months with more rides.
Eyeballing the month-by-month numbers is inconclusive:
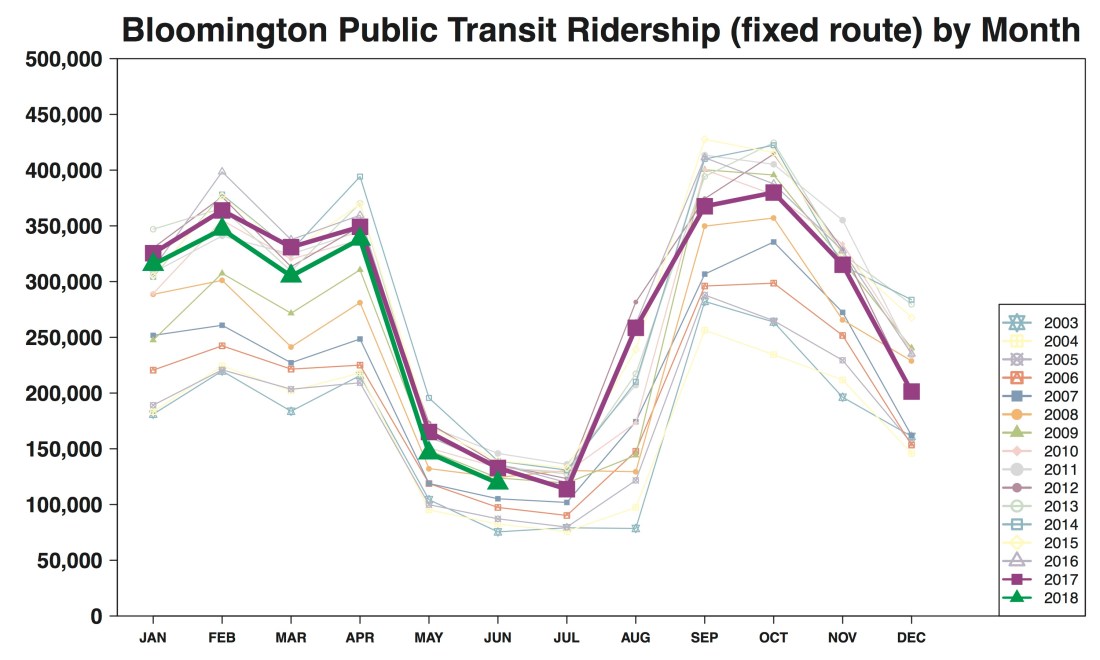
In any case, eyeballing seasonal patterns is a poor substitute for analyzing the breakdown of ridership numbers for university affiliates and non-affiliates. That’s the kind of precise data that Bloomington Transit could likely provide.
The ridership numbers presented here come from the National Transit Database, through the Urban Integrated National Transit Database maintained by the Florida Transit Information System.
Through the first six months of this year, 2018 is on pace to continue the slightly downward trend of the previous three years. In 2017, from January to June, passengers took 1,667,255 rides, compared to 1,570,548 rides for the same period this year.
